Demos

A few interactive tools we've built to show what's possible. Not tied to a client — but built the same way we'd build one for you.

Whole-School Results Dashboard

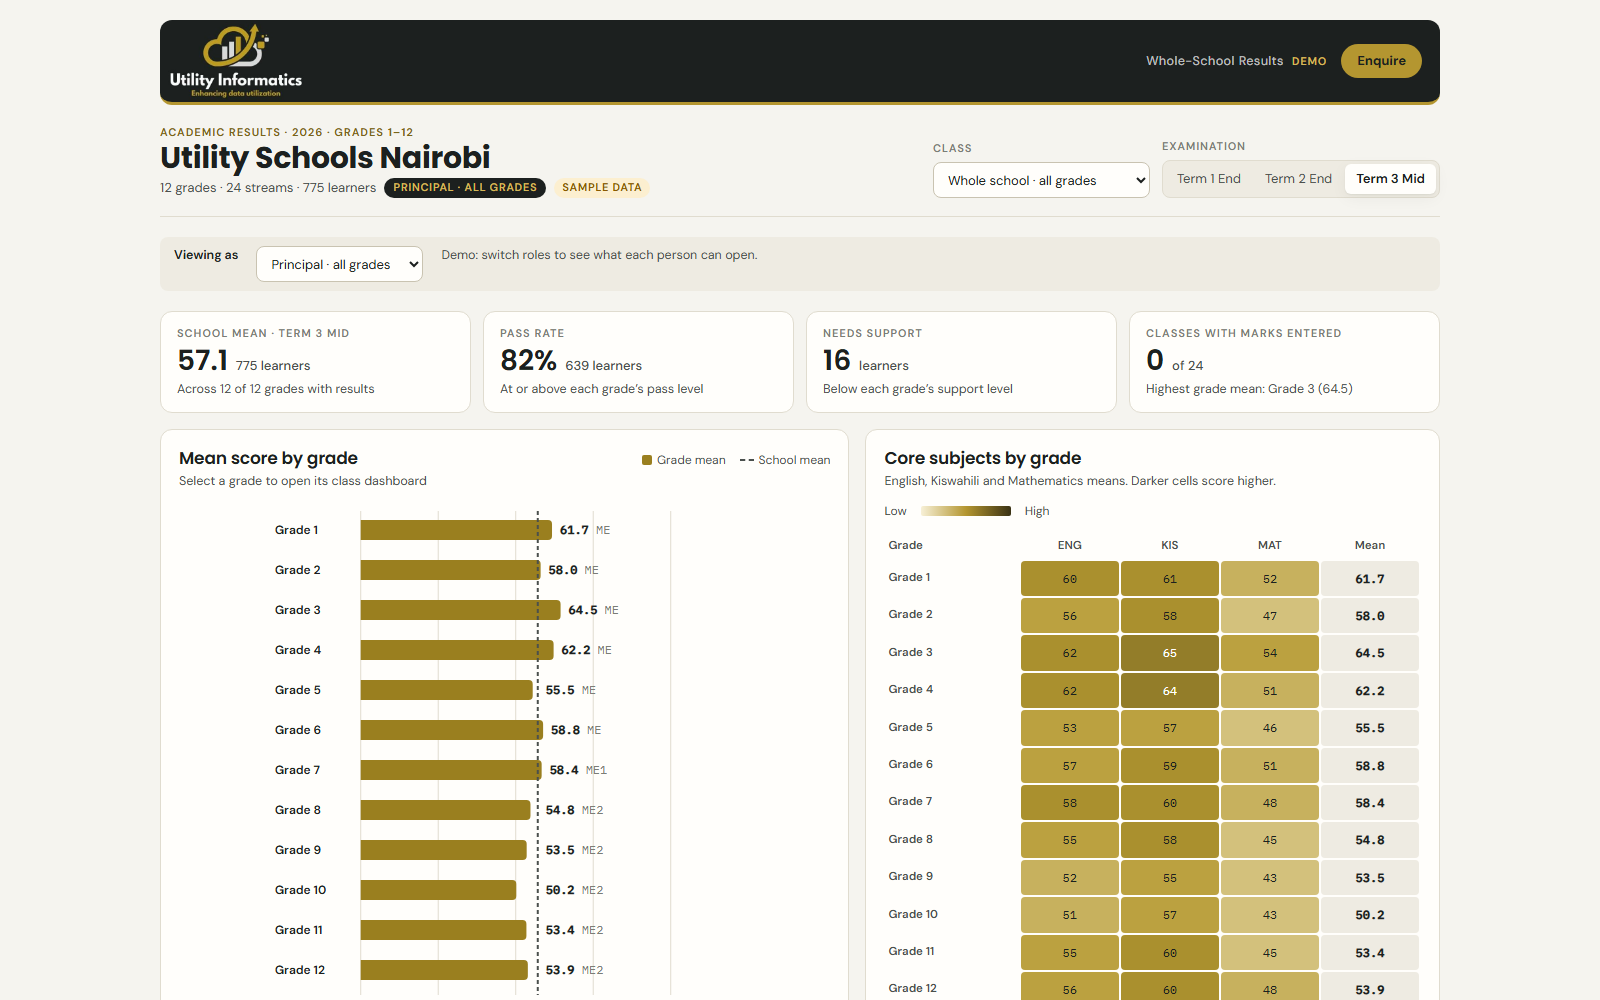
An interactive results dashboard for a school — built to turn raw exam data into something a head teacher or board can actually read at a glance: trends across exams, subjects, and classes, filterable in real time.

Related services: Business Intelligence, Reporting & Visualization Platforms.

Launch demo
Nyeri Fuel Outlets Dashboard

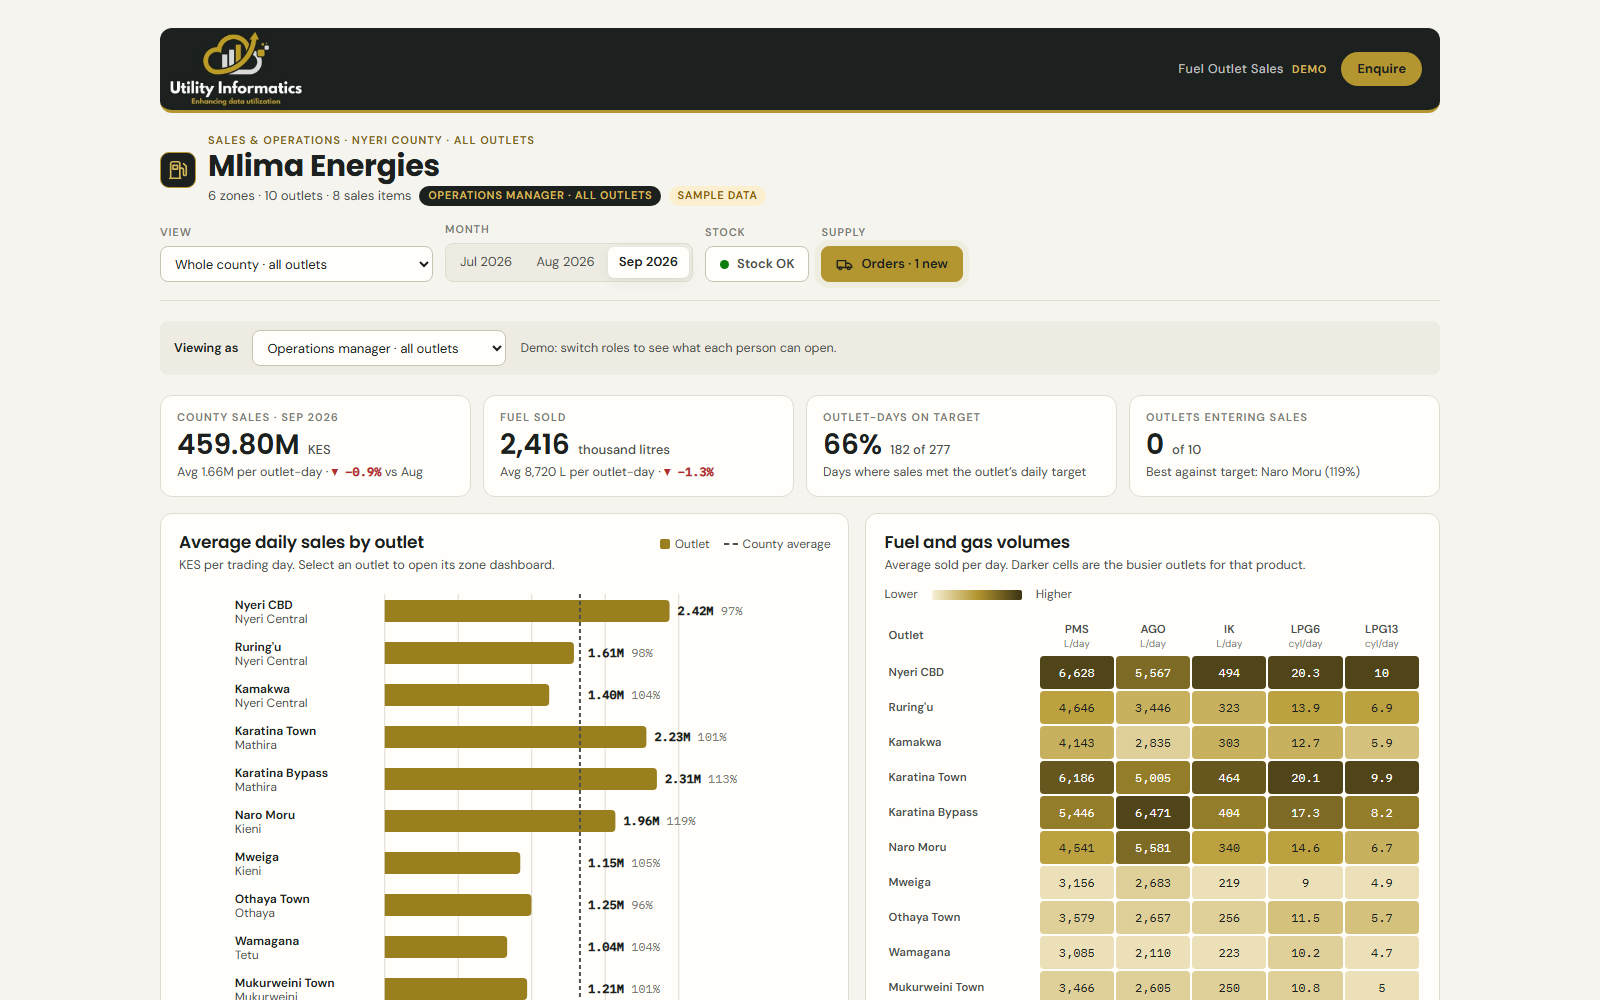
A sales, pricing, and supply dashboard for fuel stations across Nyeri — built to make outlet-level sales, pump prices, and reorder status explorable instead of buried in a spreadsheet.

Related services: Business Intelligence, Reporting & Visualization Platforms, Research, Monitoring & Evaluation.

Launch demo

Have data you'd want visualized like this?

Talk to us

Let's transform your business with data.

Talk to us